The customer lifetime value (CLV) metric is employed in many industries to measure the customer’s total revenue generated over their relationship with your brand.
CLV calculation is very common in the retail, aviation, software and hospitality industries; however, the real estate market is currently not widely exploring the benefits.
When measuring CLV, it’s best to look at the total average revenue generated by a customer and the total average profit.
The metric provides essential insights into how customers interact with your business and that your overall business plan is working as expected.
With a business model similar to the build to rent sector, the hospitality sector has a long CLV calculation history and uses the data to improve revenues.
This resulted in a consistent approach to customer segmentation: a city hotel will market more to the business traveller segment over leisure guests as business travellers return frequently and allow for more extra revenue opportunities. Leisure guests only come once or twice and often travel on a set budget.
Here is a very simplified version of how to calculate the CLV for your business:
Customer revenue per year * Duration of the relationship in years – Total costs of acquiring and serving the customer = CLV
Customer A’s revenue per year = £18,000 (based on a £1,500 p/m rent payment)
Customer relationship duration = 14 months avg.
Cost of acquisition = £600 (agent fees, viewing expenses etc.)
Price to serve = £350 per month (£4,900 over 14 months, i.e. admin, staffing, upkeep)
The subsequent math:
£1500 x 14 = £21,000 (14 months of rent as revenue)
£21,000 – £5,500 = £15,500 (revenue minus acquisition and service cost)
CLV for Customer A = £15,500
As we know, life is not linear and predictable, and you, therefore, need to account for many variables that impact the model above:
- The churn of customers and number of renewals
- Discounts or increases applied at the renewal phase
- Different economic spending patterns of your customers (i.e. segmentation)
- Differing lengths of rental contracts
One of the benefits of calculating the CLV in build to rent is solidifying and establishing the expected customer segmentation to fine-tune the marketing efforts.
Like the hotel industry, a clear customer strategy can yield higher revenues. To attract the higher revenue-generating customers, the organisation spends most of the marketing money targeted at their core segment.
In a theoretical approach, how would this look?

Bob is a single professional with a CLV of £18,000
Meet Bob
Customer B (Bob) is a single professional.
His CLV is £18,000 over an average rent tenure of 14 months for a one-bedroom apartment.
The building caters for young urban professionals and small families; all the amenities underpin the urban/professional brand theme.
Maximising your CLV
The following scenario highlights how easy extra revenue-generating activities can add to the CLV of the customers.
- Bob works from home and decides to pay for upgraded WiFi (£10 p/m)
- He enjoys mingling for a coffee in the lounge area and meeting new people
- He frequently works out in the gym and uses the offered housekeeping service once a week (£150 p/m)
- Twice a month, he joins the Club Room mixer for the residents, where he socialises and has a few of the excellent branded lagers from the owner/developer company (£20 per month)
With that in mind, you can see Bob’s CLV over the 14 months will add a sizeable sum to his baseline revenue.
| Wifi upgrade | £140 |
| Housekeeping | £2,100 |
| Socialising | £280 |
| Extra spend | £2,520 |
In this example, the project maximises Bob’s CLV by encouraging him to pay more or purchase more items, pay more often or stay longer, and make leaving harder.
Additionally, parking charges, personal training hours, maintenance and redecoration etc., can augment the CLV of your residents.
It all comes down to creating customer loyalty in exchange for a seamless and enhanced rental experience.
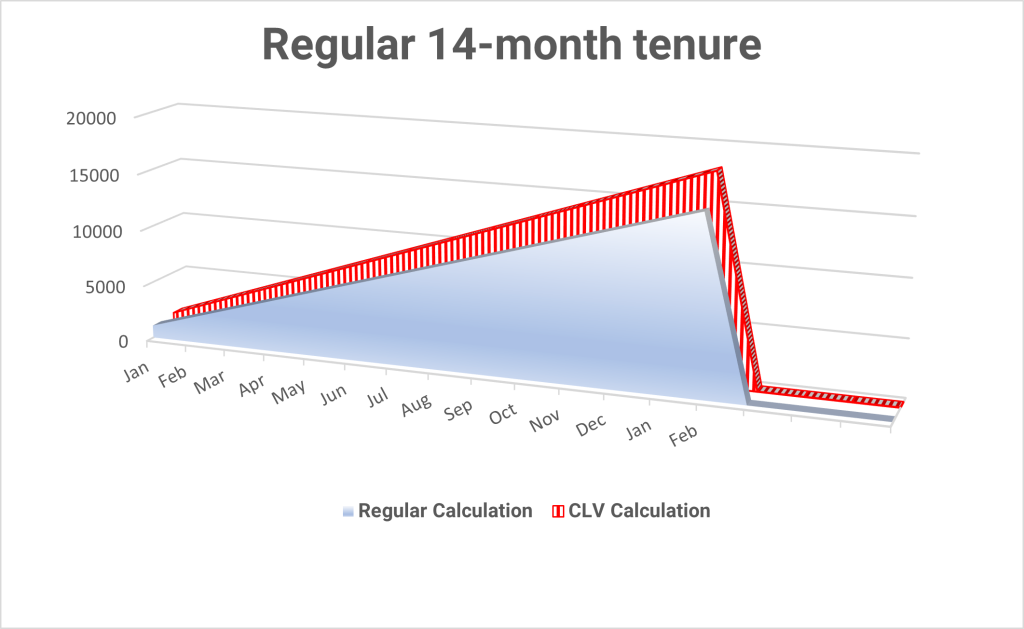
The CLV over a regular 14-month tenure
The graphic below demonstrates the added value at the point of lease renewal.
While a new tenancy starts to build up the revenue profile, Bob’s revenue continues and widens the gap to the traditional approach.
Should the owning/developing company have different city locations, the hard-won and curated customer loyalty might entice Bob to remain a customer. An attractive moving package might influence the company’s continuation of Bob’s tenant life and revenue generation.
Thus, the value proposition and comprehensive marketing programs will establish a hard-to-beat customer experience and will most certainly help with lease renewals and referrals.
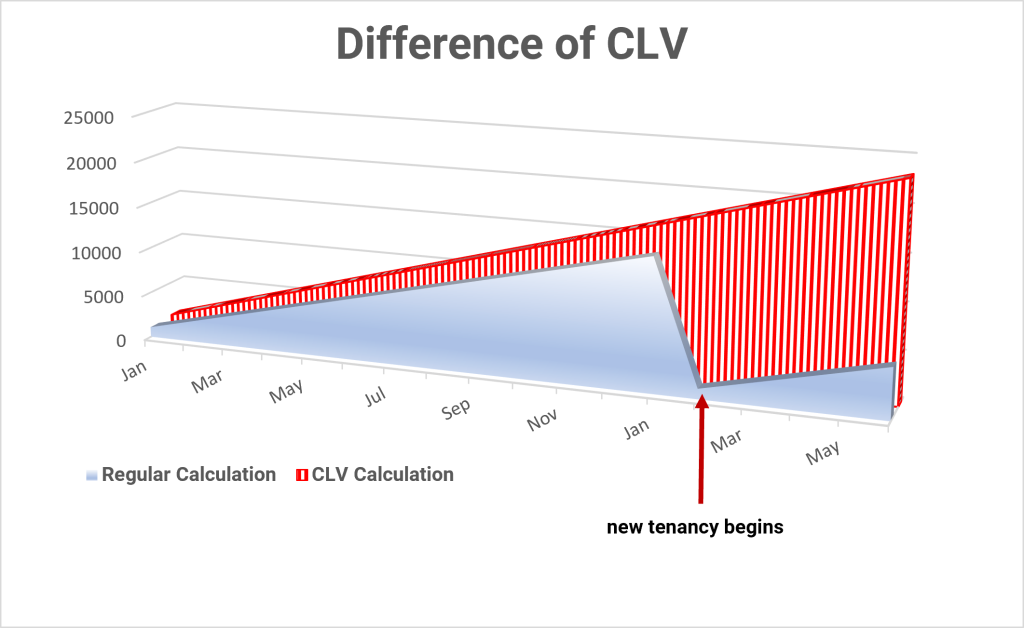
CLV at the point when a new tenancy begins
Start measuring the CLV of your customers
Putting this into your strategy for building operations as well future and existing developments allows you to optimise your marketing spend, drive loyalty whilst identifying costly experience gaps and allows your business to grow by higher leases renewals and referrals.
This link provides a fascinating insight for a detailed scientific calculation of CLV in the US housing industry (spoiler alert, it’s heavy on advanced maths!)