To set the scene, here are the two definitions for the main drivers of business improvement.
According to the website Investopedia, Key Performance Indicators (KPIs) are defined as: “A set of quantifiable measurements used to gauge a company’s overall long-term performance. KPIs specifically help determine a company’s strategic, financial, and operational achievements, especially compared to those of other businesses within the same sector.”
While the online platform Shopify defines benchmarking in business as: “A process of measuring the performance of a company’s products, services, or processes against those of another business considered to be the best in the industry, aka “best in class”. The point of benchmarking is to identify internal opportunities for improvement. By studying companies with superior performance, breaking down what makes such outstanding performance possible, and then comparing those processes to how your business operates, you can implement changes that will yield significant improvements.
How does this work? Case Study: The hotel sector
Benchmarking is a prevalent and much-trusted business practice in the hotel industry. The principle is straightforward. Aiming for a like-for-like comparison, the hotel’s revenue management selects a range of competitor hotels with a matching star rating, market share and service offering, etc.
Each night a range of metrics is automatically transferred via the hotel’s property management system and uploaded into the database of the benchmark service provider.
The database organises the various data streams and creates a daily report highlighting core business performance against the aggregated competitive set.
The point of benchmarking is to identify internal opportunities for improvement
The foundation for this process is based on creating a standardised set of key metrics obtained via the daily revenue cycle. They typically include critical performance numbers such as:
- Average Rate
- Daily occupancy
- Split into main market segments (transient, group, contract)
- Revenue per available room (RevPAR)
- Additional RevPAR analysis (rooms, food & beverage, other)
Then, the information is anonymised and portrayed as an average value, augmented with a confidential individual ranking. This allows the hotel to compare its success to a particular local market share and a selected competitive set. The data enables the revenue manager to deduce why some days are better or worse and act on that information accordingly.
Figure 1 demonstrates the simple logic behind the report.
For September, the property had higher occupancy than the comp set average, reflected in the higher index of 101.8. The Index line means it took market share from its comp set.
However, the rank of three out of five means that two hotels still did better, and two competitors suffered as a consequence.
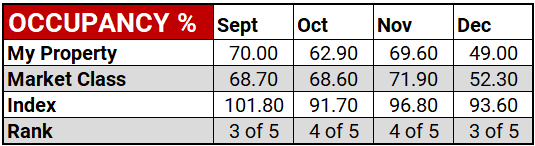
Fig 1: The property had a higher than average occupancy in September
When looking at another metric, average daily rate, in Figure 2, the reasons become more apparent.
Based on the occupancy numbers above, rates have either been set too low or occupancy has been pushed deliberately, at the expense of the average rate.
If the goal is rate, the strategy works. October and November show a higher average rate and lower occupancy. The property is falling behind for September but gaining on the rate in October and November.
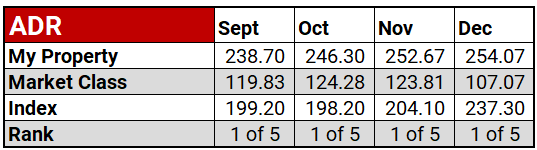
Fig 2: Average Daily Rate
The data treasure trove
Due to the unified KPIs of the benchmarking process, the hotels now can gauge the performance with their competitive set by evaluating the following, and much more:
- Daily revenue strategies
- Revenue per weekday, per rolling 3-month or 12-month period
- Relation of market segment production
- Shortfalls in rate and market penetration related to the comp set
- Quarterly or annualised trends
Unified KPIs for BTR: Where is the benefit?
The BTR industry is in its infancy but has tremendous growth potential for the UK.
The growth trajectory is very steep, according to data from the British Property Federation.
The numbers reflect the growth across the UK, focusing on the Greater London Area regarding the completion of schemes, but the there is also major BTR growth in the regions which warrants the introduction of a KPI data set because accurate comparisons can now be made within local markets.
With so many possibilities to benchmark against, there is a real opportunity for BTR developers to home in on a local competitive set – in the same way as the hotel industry.
Still, there is a snag. At this point, the UK Build to Rent sector members have not published or agreed on a sector-encompassing framework of performance metrics.
There is a reluctance to share basic information so the only sources for comparison are most likely government ones or published company reports, from which they can glean certain trends. This reluctance to share data is very high despite the urgent need for innovative benchmarking and process improvement tools.
There is a reluctance to share basic information despite the urgent need for innovative benchmarking and process improvement tools
Define what needs measuring
To have a meaningful process, products and services need to be carefully selected for competitive set. Data points which come to mind could be:
- Voids concerning overall occupancy
- Voids turn-around time in days
- Tenant turnover / retention
- Rent collected with monthly rent-roll
- Rent arrears in relation to rent-roll
- Revenue growth
- Home repairs, completed on the first visit
- Customer satisfaction scores
Data sets can be compared accurately only with quantifiable information.
Breaking down internal reluctance to arrive at and share agreed performance metrics is imperative. Through internal focus groups and sector-wide research, a comprehensive KPI frame for the BTR market in the UK should be created under the guidance of the UKAA.
Ideally, this data set should mirror existing practices of the UKAA’s partner organisation in the US, the NAA.
A similar data tool will enable investors, developers, and owner/operators to understand quickly a market or region, permitting direct comparison and guiding investment with data-driven information.
A comprehensive KPI frame for the BTR market in the UK should be created under the guidance of the UKAA
Compare, act, change – and repeat!
The benefits are obvious.
An organisation can benchmark its performance against its peers and benchmarking allows the reaping of several additional, vital benefits:
- Improving processes to increase performance and efficiencies
- Constant reviewing and realignment of operating standards
- Education of the team on what drives the operator’s/developer’s business
- Understanding critical metrics concerning a competitive set
- Allowing new entrants to the market a better overview